Chapter 6: The Arsenal (Day-to-Day Toolkit for Front Office Support)
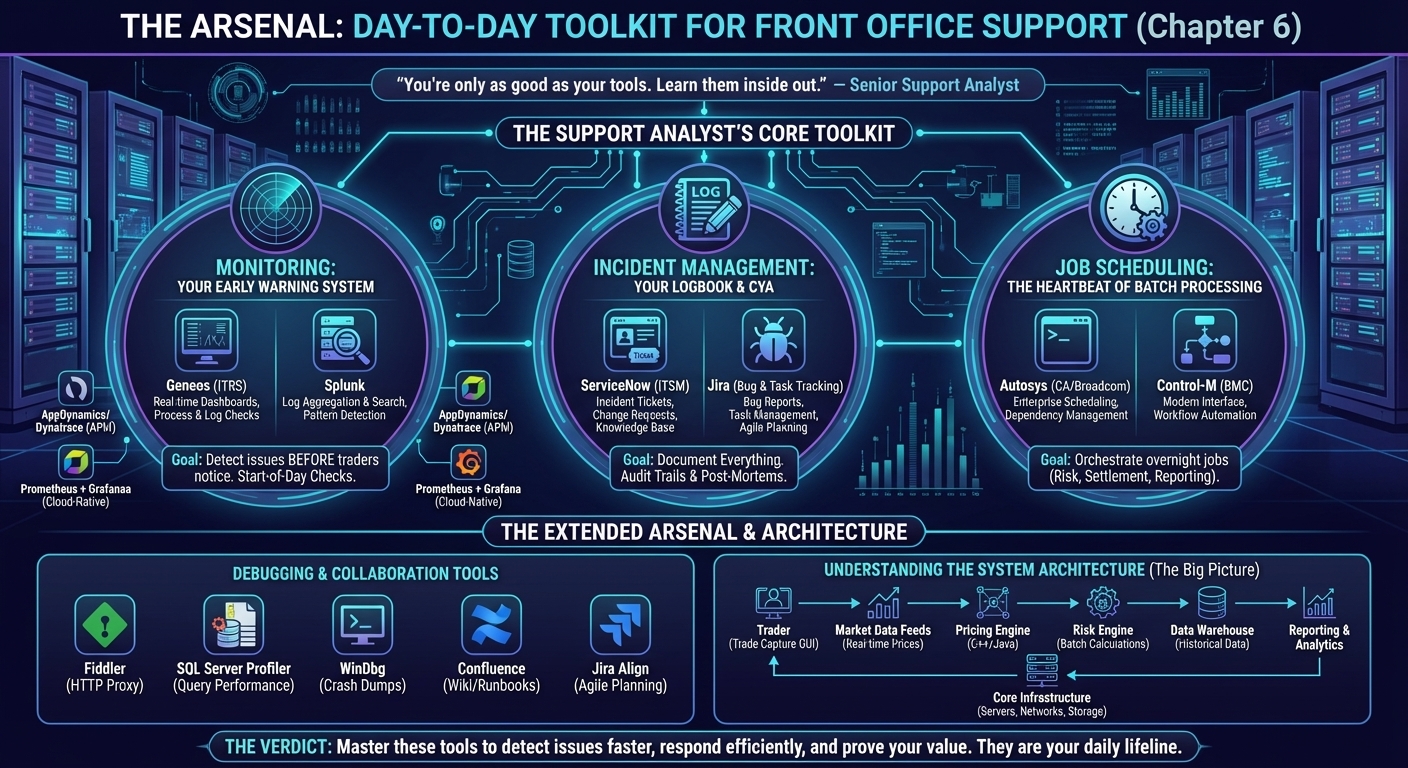
The Support Analyst's Mission Control: Your core toolkit consists of three essential systems - Monitoring tools (Geneos, Splunk, AppDynamics) act as your early warning system with real-time alerts; Incident Management platforms (ServiceNow, Jira) serve as your logbook and audit trail; and Job Scheduling systems (Autosys, Control-M) orchestrate the heartbeat of overnight batch processing. The Extended Arsenal includes debugging tools and requires deep understanding of system architecture.
"You're only as good as your tools. Learn them inside out." — Senior Support Analyst
It's 6:30 AM. The Golden Hour. Your heart rate spikes as you open your laptop. Did the overnight batch jobs complete? Are all systems green? Is the bank ready to trade?
This is the daily reality of Front Office Support. You're the first responder when systems fail. Your tools are your lifeline.
The Support Analyst's Core Toolkit
These three categories form your daily arsenal. Master them, and you'll detect issues before traders notice, respond faster than your peers, and prove your value when it matters most.
Monitoring: Your Early Warning System
The Reality: Trading systems run 24/7. You can't manually check every server, every process, every log file. You need automated monitoring to alert you when something goes wrong—before traders start screaming.
Geneos (ITRS) - The Traffic Light System
What it is: The gold standard for real-time monitoring in investment banks. If it's red, you move.
Real-World Usage (UK Investment Bank, 2014): Every morning at 6:30 AM, I'd open the Geneos dashboard:
- Green: All systems operational. Breathe easy.
- Amber: Warning (disk space at 80%, slow database queries). Investigate.
- Red: Critical failure (pricing engine down, database unreachable). Drop everything and fix it.
Key Features: * Samplers: Plugins that monitor processes, log files, database queries, custom metrics * Rules: Define thresholds (CPU > 90% for 5 minutes = alert) * Actions: Trigger emails, SMS, or restart scripts automatically
Pro Tip: Learn to write custom samplers. I created one that queried the trade database every 30 seconds. If no new trades appeared for 10 minutes during market hours, it triggered a P1 alert.
# Example Geneos sampler command
/opt/geneos/bin/netprobe -port 7036 -sampler process -process trading_app
Splunk - The Google for Logs
What it is: Log aggregation and search platform. When you need to find a needle in a 10GB haystack.
Real-World Usage (European Investment Bank, 2015): A trader reported intermittent pricing failures. Individual server logs showed nothing. I used Splunk to search across all 50 pricing servers simultaneously:
Result: 90% of errors were on server-03. Network card was failing. Escalated to infrastructure. Problem solved in 20 minutes.
Essential Splunk Commands:
# Find all errors in the last hour
index=app_logs ERROR earliest=-1h

# Count errors by server
index=app_logs ERROR | stats count by host

# Alert on high error rates
index=app_logs ERROR | bucket _time span=5m | stats count by _time | where count > 10
Pro Tip: Save your searches as alerts. I had alerts for: * More than 10 database connection errors in 5 minutes * Any FATAL errors in production logs * Batch jobs taking longer than expected
AppDynamics/Dynatrace - Application Performance Monitoring (APM)
What they are: End-to-end transaction tracing. Shows you exactly where your application is slow.
Real-World Usage (Japanese Investment Bank, 2016): Traders complained that trade confirmations were taking 30 seconds instead of 3. AppDynamics showed:
- Database query: 25 seconds (the bottleneck)
- Business logic: 3 seconds
- Network: 2 seconds
I shared the slow query with the DBA team. They added an index. Confirmations back to 3 seconds.
What APM Tools Show You: * Transaction flow through your application * Database query performance * External service dependencies * Memory leaks and garbage collection issues
Incident Management: Your Logbook & CYA
The Reality: When something breaks, you need to document everything. For audit trails, post-mortems, and covering your ass when someone asks "Why did you restart the server at 3 AM?"
ServiceNow (ITSM) - The Industry Standard
What it is: IT Service Management platform. Your official record of every incident, change, and decision.
Real-World Usage (UK Investment Bank, 2013): Overnight risk calculation failed at 3 AM. I:
- Created P1 Incident in ServiceNow (Priority: Critical - Trading Impact)
- Documented error message from Autosys logs
- Updated ticket every 15 minutes with troubleshooting steps
- Restarted the job manually after fixing database connection
- Closed ticket with root cause analysis and prevention steps
Critical ServiceNow Fields: * Priority: P1 (Critical), P2 (High), P3 (Medium), P4 (Low) * Affected Service: Which trading desk is impacted? * Root Cause: What actually caused the issue? * Resolution: Exact steps taken to fix it
Golden Rule: Always update the ticket BEFORE taking action. If you restart a server without documenting it first, and something goes wrong, you're in trouble.
Jira (Bug & Task Tracking)
What it is: Originally for software development, but widely used for incident and task tracking.
Real-World Usage (Swiss Investment Bank, 2011): Found a bug where exotic options weren't pricing correctly. I:
- Created Bug ticket with detailed description
- Attached screenshots, log files, and SQL queries showing the issue
- Assigned to development team with priority: High
- Tracked progress through daily stand-ups until fixed
Pro Tip: Be specific in bug reports. "The app is broken" is useless. "Trade ID 12345 fails to price with NullPointerException in VolatilityCalculator.java:142" gets fixed immediately.
Job Scheduling: The Heartbeat of Batch Processing
The Reality: Investment banks run hundreds of batch jobs every night. Risk calculations, trade settlement, regulatory reporting. These jobs have dependencies—Job B can't start until Job A finishes. You need a scheduler to orchestrate this symphony.
Autosys (CA/Broadcom) - The Workhorse
What it is: Enterprise job scheduling. The heartbeat of overnight processing. If the risk calculation job fails at 3 AM, the bank doesn't open.
Real-World Usage (UK Investment Bank, 2014): The overnight P&L calculation failed. I checked Autosys:
- Job Status: FAILURE
- Error: "Database connection timeout"
- Action: Restarted job manually
# Check job status
autorep -J PNL_CALC_BATCH

# Force start a job
sendevent -E FORCE_STARTJOB -J PNL_CALC_BATCH

# Put job on hold
sendevent -E JOB_OFF_ICE -J PNL_CALC_BATCH
Key Concepts: * Job: Single task (run script, execute SQL) * Box: Container for multiple jobs * Dependency: Job B starts only after Job A succeeds * Condition: External trigger (file arrival, time-based)
Control-M (BMC) - Modern Alternative
What it is: BMC's job scheduling platform. Similar to Autosys but with better UI and workflow management.
Real-World Usage (Japanese Investment Bank, 2012): Regulatory reporting job stuck in "WAIT" status. I checked Control-M—it was waiting for a file from an external vendor. File hadn't arrived. I:
- Contacted vendor to get file delivery status
- Manually placed file in expected directory once received
- Job started automatically and completed successfully
Pro Tip: Set up alerts for critical jobs. If overnight risk calculation doesn't complete by 6 AM, you want to know immediately—not when traders start calling.
The Extended Arsenal & Architecture
Beyond your core toolkit, you need specialized tools for debugging complex issues and collaborating with your team. Plus, you must understand the big picture—how all these systems connect.
Debugging & Collaboration Tools
Fiddler (HTTP Proxy) - Web Application Detective
What it is: Captures all HTTP/HTTPS traffic between browsers and servers. Essential for debugging web-based trading applications.
Real-World Usage (UK Investment Bank, 2014): Web-based trade blotter wouldn't load. Fiddler revealed: * Request to /api/trades returned 500 Internal Server Error * Response: {"error": "Database connection timeout"}
Escalated with exact error. Fixed in 20 minutes instead of hours of guessing.
SQL Server Profiler (Query Performance)
What it is: Captures every SQL query hitting SQL Server. Shows you exactly which queries are slow.
Real-World Usage (UK Investment Bank, 2014): .NET reporting service timing out. Profiler showed a query doing full table scan on 50-million rows. Suggested index to DBA. Query time: 5 minutes → 2 seconds.
WinDbg (Crash Analysis)
What it is: Low-level Windows debugger for analyzing application crashes.
Real-World Usage (UK Investment Bank, 2013): C++ pricing engine crashed overnight. Crash dump showed:
Sent dump to developers. They found null pointer bug and fixed it.Reality Check: You won't master WinDbg, but knowing how to capture crash dumps is valuable.
Confluence (Documentation & Runbooks)
What it is: Wiki-style documentation platform. Your team's knowledge base.
What I Used It For: * Runbooks: "How to restart the pricing engine" (step-by-step guides) * Architecture diagrams: Visual maps of system components * Post-mortems: Documenting major incidents and lessons learned * Contact lists: Who to call when specific systems fail
Pro Tip: Keep runbooks current. Nothing worse than following a procedure that references a server decommissioned 2 years ago.
Jira Align (Enterprise Planning)
What it is: Enterprise agile planning tool connecting tickets to strategic initiatives.
Use Case: Large transformation programs (cloud migration, system replacements). You'll see it in program manager presentations, but rarely use it directly.
Understanding the System Architecture (The Big Picture)
You can't support what you don't understand. Here's how trading systems connect and where failures impact the business.
The Trading System Flow
-
Trade Capture & Blotter (Front-End GUI)
- Technology: Java Swing, .NET WPF, or web-based
- Function: Traders enter trades, validate against rules
- Your Support: "Can't enter trades" → Check GUI-to-backend connectivity
-
Market Data Feeds (Real-Time Prices)
- Technology: Bloomberg B-PIPE, Reuters RMDS
- Function: Streams live prices for all instruments
- Your Support: "Stale prices" → Check feed connectivity
- Priority: P1 during market hours (traders can't price without data)
-
Reference Data (Master Data)
- Technology: Oracle/SQL Server databases
- Function: Instrument definitions, counterparty details, holiday calendars
- Your Support: "Instrument not pricing" → Check if it exists in reference data
-
Pricing Engine (The Brain)
- Technology: C++/Java for performance
- Function: Market data + trade details + models = trade value
- Your Support: Keep it running, escalate pricing bugs to developers
-
Risk Engine (Overnight Calculations)
- Technology: C++/Java batch processing
- Function: Calculates portfolio risk (Greeks, VaR, stress tests)
- Your Support: Monitor overnight batch jobs, restart failures
-
Data Warehouse (Historical Storage)
- Technology: Oracle, SQL Server, or cloud platforms
- Function: Stores historical trades, prices, risk metrics
- Your Support: Monitor ETL jobs, troubleshoot data quality issues
-
Core Infrastructure (The Foundation)
- Components: Servers, networks, storage, load balancers, firewalls
- Your Support: Escalate hardware issues, monitor performance
How Failures Cascade
Example Failure Chain: 1. Network switch fails → Database becomes unreachable 2. Pricing engine can't connect → Trades stop pricing 3. Traders can't see P&L → Business impact escalates 4. Risk calculations fail → Regulatory reporting at risk
Your Job: Identify the root cause (network) vs. symptoms (pricing failures) and communicate impact clearly.
The Daily Routine: Start-of-Day Checklist
Here's what my typical "Golden Hour" looked like:
6:30 AM - The Anxiety Check: 1. Open Geneos: All systems green? Any red alerts overnight? 2. Check Autosys/Control-M: Did overnight batch jobs complete? 3. Scan Splunk: Any unusual error spikes in the logs? 4. Review ServiceNow: Any open P1/P2 incidents from night shift?
If Everything is Green: Send "Start-of-Day: All Clear" email to trading desks.
If Something is Red: 1. Assess impact: Which desks affected? Can they trade? 2. Create incident ticket: Document everything in ServiceNow 3. Communicate: Update stakeholders every 30 minutes until resolved 4. Escalate: Bring in specialists if needed
War Story: The Credit Suisse Morning (2010): 6:45 AM - Geneos showed red alerts: Bloomberg feed disconnected, Eurex market data stale. Traders arriving in 15 minutes for market open.
I immediately: 1. Created P1 incident in ServiceNow 2. Called market data team (escalation procedure) 3. Sent email to all trading desks: "Market data issue - investigating" 4. Monitored feeds while market data team worked 5. Confirmed restoration at 7:05 AM - just before market open
Result: Traders had full market data for market open. Crisis averted through proper monitoring and rapid response.
The Verdict: Master These Tools to Detect Issues Faster, Respond Efficiently, and Prove Your Value
These tools are your daily lifeline. You'll spend more time in Geneos, ServiceNow, and Autosys than in email. They're not just software—they're your reputation.
The Three Pillars of Support Excellence
-
Monitoring Mastery
- Geneos: Your early warning system. Learn custom samplers.
- Splunk: Your log detective. Master search syntax and alerts.
- APM Tools: Your performance analyzer. Understand transaction flows.
-
Incident Management Discipline
- ServiceNow: Your official record. Document everything before acting.
- Jira: Your development bridge. Write specific, actionable bug reports.
- Communication: Update stakeholders every 30 minutes during incidents.
-
Batch Processing Vigilance
- Autosys/Control-M: The bank’s heartbeat. Learn command-line interfaces.
- Dependencies: Understand job flows. Know what breaks when jobs fail.
- Alerts: Set up notifications for critical overnight processes.
War Story: The Tool That Saved My Career (UK Investment Bank, 2013)
The Crisis: 2 AM Saturday morning. Overnight risk calculation failed. Monday morning, traders need their risk reports to open positions. No reports = no trading = millions in lost revenue.
The Problem: Risk engine crashed with cryptic error. Logs showed nothing useful. Development team unreachable until Monday.
The Solution: I used three tools in sequence:
- Splunk: Searched across all servers for related errors. Found database connection timeouts starting 30 minutes before the crash.
- Geneos: Checked database server metrics. CPU spiked to 100% at the same time.
- Autosys: Identified a rogue batch job consuming all database resources.
The Fix: Killed the rogue job. Restarted risk calculation. Reports ready by 6 AM Monday.
The Lesson: Tools amplify your capabilities. Without Splunk, I'd never have found the connection timeout pattern. Without Geneos, I wouldn't have seen the CPU spike. Without Autosys, I couldn't have identified the rogue job.
Action Items: Build Your Arsenal
- Get hands-on access: Request training environments for Geneos, Splunk, ServiceNow
- Learn the shortcuts: Command-line interfaces, saved searches, custom dashboards
- Practice the routine: Simulate the 6:30 AM start-of-day checklist
- Document everything: Create your own runbooks and troubleshooting guides
- Build relationships: Know who to call for each system when escalation is needed
The Reality Check
As a Support Analyst, you're not expected to: - Build monitoring dashboards from scratch (that's DevOps) - Write complex Splunk queries (basic searches are enough) - Design job scheduling workflows (you operate existing ones)
You ARE expected to: - Detect issues before traders notice them - Respond quickly when alerts fire - Document thoroughly for audit trails - Communicate clearly during incidents - Escalate appropriately when you hit your limits
The Career Impact
Master these tools, and you become indispensable: - You're the person who catches issues at 3 AM before they impact trading - You're the one who can quickly diagnose problems while others are still logging in - You're the analyst who provides clear, documented incident reports - You're the team member who knows exactly who to call and when
Ignore these tools, and you become a liability: - You miss critical alerts and traders lose money - You waste time on manual checks that should be automated - You create incidents without proper documentation - You escalate everything because you can't diagnose basic issues
Next up: Chapter 7 - Rules of Engagement. How to handle the pressure when everything goes wrong and traders are screaming.