Chapter 8: The Economic War Theatre (Domain Knowledge)
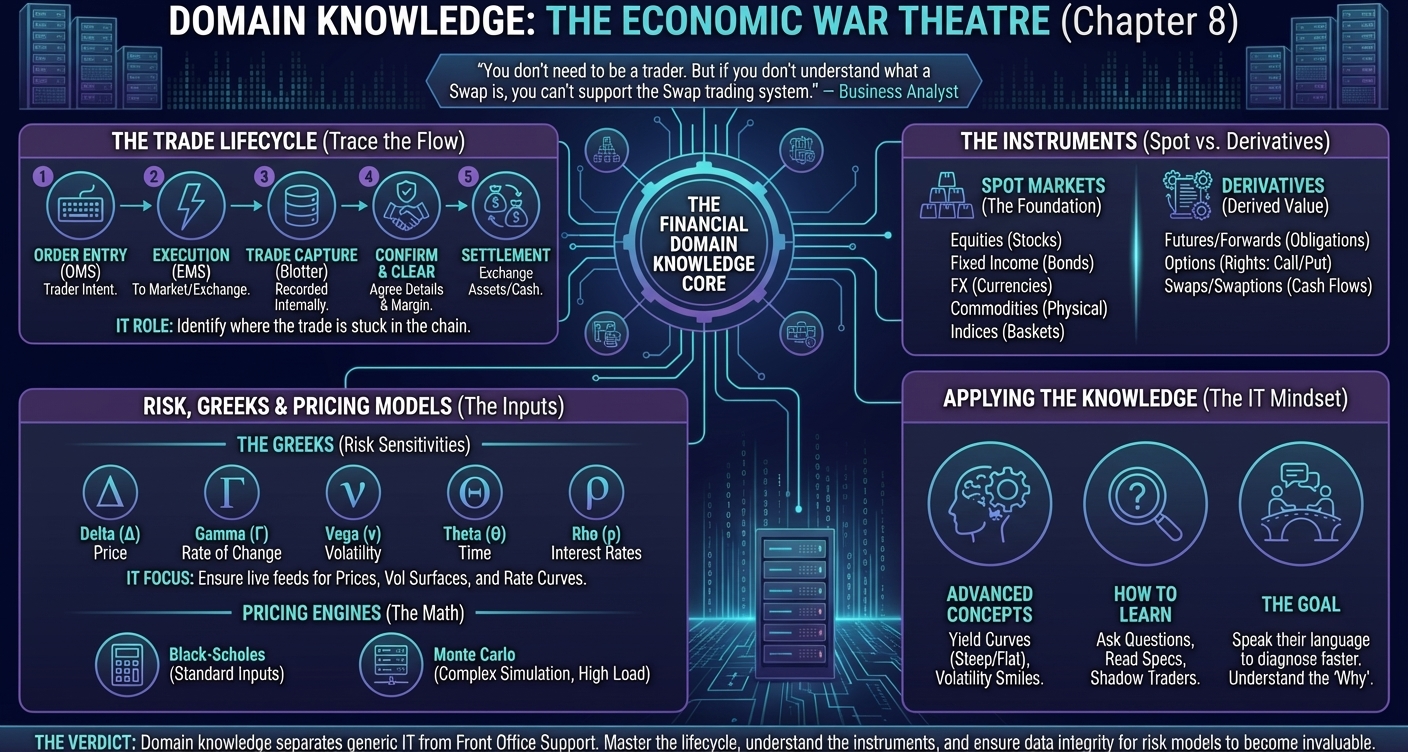
"You don't need to be a trader. But if you don't understand what a Swap is, you can't support the Swap trading system." — Business Analyst
You can be the best Unix admin, the fastest SQL query writer, and the most efficient scripter—but if you don't understand what the business does, you'll always be limited.
This chapter covers the financial domain knowledge you need as a Front Office Support Analyst. Not to become a trader, but to speak their language and understand why a system failure matters.
Why Domain Knowledge Matters
Scenario 1: A trader calls: "My Swaption isn't pricing correctly."
Without domain knowledge: "Uh... what's a Swaption? Let me check the logs."
With domain knowledge: "Is it a European or American Swaption? What's the strike and expiry? Let me check if the volatility surface is loading correctly."
The difference: The second response shows you understand the business. You can ask intelligent questions and diagnose faster.
The Instruments (What Traders Trade)
Spot Markets (The Foundation)
Before we dive into derivatives, understand the underlying assets that derivatives are based on.
Equities (Stocks)
What: Shares in a company.
Example: 100 shares of Apple at $150/share.
Why IT cares: Equity trading systems need to handle:
- Real-time price feeds (Bloomberg, Reuters).
- Order management (buy/sell orders).
- Settlement (transferring ownership).
Fixed Income (Bonds)
What: Debt instruments. You lend money to a government or corporation, and they pay you interest.
Example: A 10-year US Treasury bond paying 3% annually.
Why IT cares: Bond pricing is complex (yield curves, credit spreads). Systems need to:
- Calculate present value.
- Handle coupon payments.
- Manage maturity dates.
Commodities
What: Physical goods traded on exchanges.
Examples:
- Energy: Crude oil, natural gas.
- Metals: Gold, silver, copper.
- Agriculture: Wheat, corn, soybeans.
Why IT cares: Commodity trading systems need:
- Real-time price feeds from exchanges (NYMEX, LME).
- Storage and delivery logistics data.
- Weather data (for agricultural commodities).
Real-World Example (UK Bank, 2014): A commodities desk traded crude oil futures. The pricing system needed live data from NYMEX (New York Mercantile Exchange). When the feed went down, traders couldn't see prices. Priority: P1.
Indices
What: A basket of stocks representing a market or sector.
Examples:
- S&P 500: 500 large US companies.
- FTSE 100: 100 largest UK companies.
- Nikkei 225: 225 Japanese companies.
Why IT cares: Index trading systems need:
- Real-time index values (calculated from constituent stocks).
- Rebalancing data (when constituents change).
- Dividend adjustments.
Foreign Exchange (FX)
What: Trading currencies.
Example: Buy 1 million EUR, sell 1.1 million USD (EUR/USD = 1.10).
Why IT cares: FX markets are 24/7. Systems need:
- Real-time exchange rates.
- Low-latency execution (microseconds matter).
- Multi-currency support.
Derivatives (The Complex Instruments)
What: Financial contracts whose value is derived from an underlying asset (stock, bond, commodity, currency, index).
Why they exist: Hedging risk, speculation, arbitrage.
Why IT cares: Derivatives are complex. Pricing models involve volatility calculations, Monte Carlo simulations, and risk sensitivities (the Greeks).
Derivatives by Asset Class
Derivatives are categorized by what they're based on:
- Equity Derivatives: Based on stocks or stock indices (e.g., S&P 500 options).
- FX Derivatives: Based on currency pairs (e.g., EUR/USD options).
- Commodity Derivatives: Based on physical goods (e.g., crude oil futures).
- Interest Rate Derivatives: Based on interest rates (e.g., interest rate swaps).
- Credit Derivatives: Based on credit risk (e.g., credit default swaps).
- Fixed Income Derivatives: Based on bonds (e.g., bond futures).
- Exotic Derivatives: Custom, complex structures (e.g., barrier options, Asian options).
The Four Main Types of Derivatives
Futures
What: Obligation to buy/sell an asset at a future date at a predetermined price.
Example: A farmer agrees to sell 1,000 bushels of wheat in 6 months at $5/bushel.
Key Features:
- Standardized: Traded on exchanges (CME, ICE).
- Margin: Requires collateral.
- Mark-to-market: Daily settlement of gains/losses.
Why IT cares: Futures systems need:
- Real-time exchange connectivity.
- Margin calculations.
- Daily P&L updates.
Real-World Example (Swiss Bank, 2011): The futures desk traded S&P 500 futures. The system needed to:
- Fetch live index values from CME.
- Calculate margin requirements.
- Update positions in real-time.
When the CME feed went down, traders couldn't see their positions. I escalated to the market data team.
Forwards
What: Similar to futures, but customized and traded over-the-counter (OTC), not on exchanges.
Example: A company agrees to buy 1 million EUR in 3 months at a rate of 1.10 USD/EUR.
Key Differences from Futures:
- Customized: Any amount, any date.
- No exchange: Traded directly between parties.
- Counterparty risk: If one party defaults, the other loses.
Why IT cares: Forward systems need:
- Custom trade capture (non-standard terms).
- Counterparty credit checks.
- Settlement tracking.
Options
What: The right (but not obligation) to buy/sell an asset at a predetermined price (strike) before/on a specific date (expiry).
Types:
- Call Option: Right to buy.
- Put Option: Right to sell.
Example: Buy a call option on Apple stock with a strike of $150, expiring in 3 months. If Apple goes to $160, you can buy at $150 and sell at $160 (profit: $10/share).
Option Styles (When You Can Exercise):
- American Options: Can be exercised any time before expiry. Most common in US equity markets.
- European Options: Can only be exercised on the expiry date. Common in FX and index options.
- Asian Options: Payoff based on the average price of the underlying over a period. Used to reduce volatility risk.
- Bermudan Options: Can be exercised on specific dates (e.g., quarterly). A hybrid between American and European.
Why IT cares: Option pricing is complex. Systems need:
- Volatility surfaces (implied volatility for different strikes and expiries).
- Pricing models (Black-Scholes, binomial trees).
- Greeks calculations (Delta, Gamma, Vega, Theta, Rho).
Real-World Example (European Bank, 2007): I supported a system that priced exotic options (Asian, Bermudan). The pricing engine used Monte Carlo simulations, which took 10-30 seconds per option. If the engine crashed, traders couldn't price new trades.
Swaps
What: Agreement to exchange cash flows between two parties.
Why they exist: Hedging interest rate risk, currency risk, or speculating on rate movements.
Types of Swaps:
- Interest Rate Swap: Exchange fixed interest payments for floating (e.g., pay 3% fixed, receive LIBOR + 0.5%).
- Use case: A company with a floating-rate loan wants fixed payments to reduce uncertainty.
-
Why IT cares: Systems need to fetch LIBOR rates, calculate present value of both legs, compute risk.
-
Basis Swap: Exchange one floating rate for another (e.g., 3-month LIBOR for 6-month LIBOR).
-
Use case: Arbitrage between different rate indices.
-
Currency Swap: Exchange principal and interest in one currency for another.
- Example: A US company borrows in EUR but wants USD. They swap with a European company that wants EUR.
-
Why IT cares: Multi-currency calculations, FX rate feeds.
-
Volatility Swap: Exchange realized volatility for a fixed volatility.
- Use case: Hedge against volatility spikes.
-
Why IT cares: Systems need historical volatility data.
-
Dividend Swap: Exchange fixed payments for actual dividends paid by a stock.
-
Use case: Hedge dividend risk.
-
Debt-for-environmental Swap: Rare. A country's debt is forgiven in exchange for environmental conservation.
-
Why IT cares: You probably won't encounter this in trading systems.
-
Property Swap: Exchange property-related cash flows (e.g., rental income).
- Why IT cares: Niche. Rare in investment banks.
Real-World Example (UK Bank, 2013): I supported an Interest Rate Swap system. A trader created a 10-year swap with:
- Notional: $100 million.
- Fixed leg: 3% annually.
- Floating leg: 3-month LIBOR + 0.5%.
The system had to:
- Fetch LIBOR rates every 3 months.
- Calculate the net cash flow (fixed vs floating).
- Compute risk (Delta, Vega, Rho).
When LIBOR rates spiked, the swap's value changed dramatically. Traders needed accurate, real-time valuations.
Swaptions
What: An option to enter into a swap.
Example: Buy the right to enter a 5-year interest rate swap in 1 year.
Why they exist: Hedging future interest rate exposure.
Types:
- Payer Swaption: Right to pay fixed, receive floating.
- Receiver Swaption: Right to receive fixed, pay floating.
Why IT cares: Swaption pricing is complex. Requires:
- Volatility surfaces.
- Interest rate models.
- Monte Carlo or lattice methods.
Real-World Example (European Bank, 2007): The Structured Rates desk traded Swaptions. The pricing engine took 20-30 seconds to price a single Swaption (due to Monte Carlo simulations). If the engine was slow or crashed, traders couldn't quote prices to clients.
The Trade Lifecycle (From Idea to Settlement)
Understanding the trade lifecycle is critical. When a trader says "My trade isn't showing up," you need to know where in the lifecycle it's stuck.
Step 1: Order Entry
What: Trader decides to buy/sell.
System: Order Management System (OMS).
IT Issue: "Order rejected—invalid instrument code."
Step 2: Execution
What: Order is sent to the market (exchange or broker).
System: Execution Management System (EMS).
IT Issue: "Execution failed—connectivity to exchange lost."
Step 3: Trade Capture
What: Executed trade is recorded in the bank's system.
System: Trade Blotter.
IT Issue: "Trade not appearing in blotter—database write failed."
Step 4: Confirmation
What: Both parties agree on trade details.
System: Confirmation System.
IT Issue: "Confirmation email not sent—SMTP server down."
Step 5: Clearing
What: A clearinghouse becomes the counterparty to both sides (reduces risk).
System: Clearing System.
IT Issue: "Trade rejected by clearinghouse—missing margin."
Step 6: Settlement
What: Money and assets are exchanged.
System: Settlement System.
IT Issue: "Settlement failed—insufficient funds in account."
Real-World Example (UK Bank, 2013): A trader reported: "I executed a trade 2 hours ago, but it's not in the risk system."
I traced the lifecycle:
- Order Entry: ✓ (Trade in OMS)
- Execution: ✓ (Trade executed on exchange)
- Trade Capture: ✗ (Trade stuck in queue)
Root cause: The trade capture service had crashed. I restarted it. Trade appeared in the risk system within 5 minutes.
Risk (Why the Greeks Matter to IT)
Traders don't just care about profit/loss. They care about risk. The Greeks measure how sensitive a derivative's price is to various factors.
Delta (Δ)
What: Sensitivity to the underlying asset's price.
Example: If a call option has a Delta of 0.5, and the stock price increases by $1, the option price increases by $0.50.
Why IT cares: Risk systems calculate Delta for every position. If the calculation is wrong, traders make bad decisions.
Gamma (Γ)
What: Sensitivity of Delta to the underlying asset's price (Delta's rate of change).
Why IT cares: High Gamma means risk changes rapidly. Systems need to recalculate frequently.
Vega (ν)
What: Sensitivity to volatility.
Why IT cares: Volatility data comes from external feeds (Bloomberg). If the feed is stale, Vega calculations are wrong.
Theta (Θ)
What: Sensitivity to time decay.
Why IT cares: Options lose value as they approach expiry. Systems need accurate time calculations.
Rho (ρ)
What: Sensitivity to interest rates.
Why IT cares: Interest rate data comes from central banks. If the data feed fails, Rho calculations are wrong.
Lambda (λ) / Vega (Alternative Name)
What: Sometimes used as an alternative name for Vega, or to measure leverage (percentage change in option value for percentage change in underlying).
Why IT cares: Rare in most systems, but you might see it in academic pricing models or exotic derivatives.
Epsilon (ε)
What: Sensitivity to the dividend yield of the underlying asset.
Why IT cares: For equity options, dividend payments affect pricing. If dividend data is wrong, Epsilon (and the option price) will be wrong.
Real-World Example (Swiss Bank, 2011): A trader complained: "My Delta is wrong."
I checked the pricing engine logs. The volatility surface (used to calculate Delta) hadn't updated in 2 hours. The market data feed had disconnected. I restarted the feed. Delta recalculated correctly.
Lesson: You don't need to calculate the Greeks yourself. But you need to know what data they depend on so you can troubleshoot when they're wrong.
Advanced Risk Concepts (The Yield Curve and Volatility)
Beyond the Greeks, traders monitor broader market conditions that affect their portfolios.
The Yield Curve
What: A graph showing interest rates for bonds of different maturities.
Example:
- 1-year Treasury: 2%
- 5-year Treasury: 3%
- 10-year Treasury: 4%
- 30-year Treasury: 4.5%
Normal Curve: Long-term rates higher than short-term (upward sloping).
Inverted Curve: Short-term rates higher than long-term (downward sloping). Often predicts recession.
Why IT cares: Interest rate derivatives (swaps, swaptions) are priced using the yield curve. If the curve data is stale or wrong, pricing breaks.
Real-World Example (UK Bank, 2013): The overnight batch job that updated the yield curve failed. When traders arrived in the morning, all interest rate swaps were mispriced. I restarted the job. Yield curve updated. Pricing corrected.
Yield Curve Movements
Traders care about how the curve moves, not just the absolute levels.
Bull Steepening
What: Short-term rates fall faster than long-term rates. The curve gets steeper.
Why it happens: Central bank cuts rates (bullish for bonds).
Impact: Long-term bonds gain more value than short-term bonds.
Bull Flattening
What: Long-term rates fall faster than short-term rates. The curve gets flatter.
Why it happens: Investors expect slower growth, buy long-term bonds.
Impact: Long-term bonds gain more value.
Bear Steepening
What: Long-term rates rise faster than short-term rates. The curve gets steeper.
Why it happens: Investors expect inflation, sell long-term bonds.
Impact: Long-term bonds lose more value.
Bear Flattening
What: Short-term rates rise faster than long-term rates. The curve gets flatter.
Why it happens: Central bank raises rates (bearish for bonds).
Impact: Short-term bonds lose more value.
Why IT cares: Risk systems calculate exposure to yield curve movements. If a trader has a position that loses money in a "Bear Steepening" scenario, the risk system needs to flag it.
Volatility Smile
What: A graph showing implied volatility for options at different strike prices.
Why it's called a "smile": For equity options, out-of-the-money puts (low strikes) and calls (high strikes) have higher implied volatility than at-the-money options. The graph looks like a smile.
Why it matters: The Black-Scholes model assumes constant volatility. In reality, volatility varies by strike. Pricing engines need to use a volatility surface (volatility for every strike and expiry).
Why IT cares: If the volatility surface isn't loading correctly, option prices will be wrong.
Real-World Example (European Bank, 2007): The volatility surface for EUR/USD options wasn't updating. I checked the market data feed: it had disconnected overnight. I restarted the feed. Volatility surface updated. Option pricing resumed.
Pricing Models (The Math Behind the Magic)
You won't implement these models, but you need to know they exist and what data they require.
Black-Scholes Model
What: The most famous option pricing model. Calculates the theoretical price of European options.
Inputs:
- Current price of the underlying asset.
- Strike price.
- Time to expiry.
- Risk-free interest rate.
- Volatility.
Merton Extension (More Common in Investment Banks):
- 6th Input: Dividend yield (or continuous dividend rate).
- Why it matters: Stocks pay dividends, which affect option pricing. The Merton model extends Black-Scholes to account for this.
- Why IT cares: If dividend data is missing or wrong, option prices will be incorrect. Systems need to fetch dividend schedules from reference data.
Why IT cares: If any input is wrong (stale price, wrong volatility, missing dividends), the option price will be wrong.
Limitations: Assumes constant volatility (not realistic). Doesn't work for American options or exotic options.
Real-World Example (Swiss Bank, 2011): The Black-Scholes pricing engine crashed during market open. I restarted it. Traders could price options again. Root cause: A divide-by-zero error when volatility was zero (bad data from the market data feed).
Monte Carlo Simulation
What: A method for pricing complex derivatives by simulating thousands of possible future price paths.
How it works:
- Simulate 10,000 possible paths for the underlying asset's price.
- For each path, calculate the derivative's payoff.
- Average the payoffs and discount to present value.
Why IT cares: Monte Carlo is slow. Pricing a single exotic option can take 10-30 seconds. If the pricing engine is slow or crashes, traders can't quote prices.
Real-World Example (European Bank, 2007): The Structured Rates desk used Monte Carlo to price Asian options and Bermudan Swaptions. During high volatility, traders needed to reprice hundreds of options. The pricing engine couldn't keep up. We added more servers to distribute the load.
Binomial Options Pricing Model
What: A discrete-time model that builds a "tree" of possible price movements.
How it works:
- Start with the current price.
- At each time step, the price can go up or down.
- Build a tree of all possible paths.
- Work backward from expiry to calculate the option's value.
Why IT cares: Faster than Monte Carlo for American options. But still computationally intensive.
Use case: Pricing American options (which can be exercised early).
Why IT Needs to Know These Exist
You won't write pricing models. But when a trader says "The price looks wrong," you need to know:
- Which model is being used? (Black-Scholes, Monte Carlo, Binomial)
- What data does it need? (Spot price, volatility, interest rates)
- Is the data correct? (Check market data feeds, reference data)
Real-World Example (UK Bank, 2013): A trader complained that a Swaption price was off by 10%. I checked:
- Model: Monte Carlo.
- Inputs: Spot rates, volatility surface, interest rate curve.
- Issue: The interest rate curve hadn't updated overnight (batch job failed).
I restarted the batch job. Curve updated. Swaption repriced correctly.
Structured Products (The Complex Stuff)
What: Custom financial instruments built from simpler components.
Example: A "Barrier Option" that only pays out if the stock price never falls below $100.
Why IT cares: Structured products require:
- Custom pricing models.
- Complex data structures.
- Regulatory reporting.
Real-World Example (UK Bank, 2013): I supported a system that priced Interest Rate Swaps. A trader created a custom swap with:
- Fixed leg: 3% annually.
- Floating leg: LIBOR + 0.5%.
- Notional: $100 million.
- Maturity: 10 years.
The system had to:
- Fetch LIBOR rates from an external feed.
- Calculate present value of both legs.
- Compute risk sensitivities (Delta, Vega, Rho).
When the system broke, I needed to understand the swap structure to diagnose whether the issue was:
- Missing LIBOR data.
- Incorrect discount curve.
- Bug in the pricing model.
How to Learn Domain Knowledge
Ask Questions
Don't be afraid to look stupid. Traders would rather explain a concept once than deal with you making the wrong assumptions.
Good questions:
- "What's the difference between a European and American option?"
- "Why does this trade need to settle T+2 instead of T+1?"
- "What happens if the volatility feed goes stale?"
Read the Documentation
Every trading system has functional specifications. Read them. They explain:
- What instruments the system supports.
- How pricing works.
- What data feeds are required.
Shadow the Business
Spend a day sitting with a trader. Watch how they use the system. You'll learn more in 8 hours than in 8 weeks of reading.
Take a Course
Many banks offer internal training on:
- Derivatives basics.
- Risk management.
- Regulatory requirements.
External resources:
- Book: "Trading and Exchanges" by Larry Harris.
- Online: Khan Academy (Finance & Capital Markets).
- Certification: CFA Level 1 (if you're serious).
What You Don't Need to Know
You're not expected to:
- Price a derivative from scratch.
- Build a volatility surface.
- Understand every exotic product.
Your job is to support the systems that do those things. You need enough knowledge to:
- Ask intelligent questions.
- Diagnose data issues.
- Communicate with traders.
The Verdict
Domain knowledge is what separates a generic IT support person from a Front Office Support Analyst. It's the difference between being told what to do and understanding why it matters.
Action Items:
- Learn the basics: Equities, bonds, FX, commodities, indices, derivatives.
- Understand the trade lifecycle: Order → Execution → Capture → Clearing → Settlement.
- Know the derivatives: Futures, forwards, options (American, European, Asian, Bermudan), swaps (interest rate, currency, basis, volatility), swaptions.
- Know the Greeks: Delta, Gamma, Vega, Theta, Rho, Lambda, Epsilon (what they measure, not how to calculate them).
- Understand risk concepts: Yield curve, Bull/Bear Steepening/Flattening, Volatility Smile.
- Know the pricing models exist: Black-Scholes, Monte Carlo, Binomial (what data they need).
- Ask questions: Every time a trader mentions something you don't understand, ask.
If you can speak the language of the business, you'll be invaluable.
Next up: Chapter 9 - The Promotion Ladder (Career Progression).